I though it’d be interesting to take a look at all the Google Analytics since I installed them on House of Rave somewhere around the beginning of 2006. I’ll only use Google Analytics because they are probably far more accurate than my server’s reports (which I believe counts viewing an image as a full unique visit which may distort the number of TRUE visitors to the site):
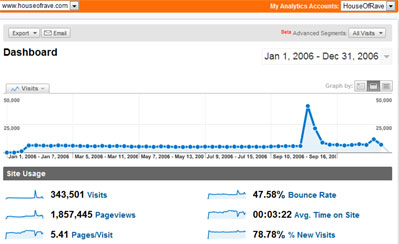
2006:
I had to put this report on a weekly view rather than daily so the rest of the years analytics even show. There was an “event” that caused hits to go from a few hundred per day to about 50,000 one day then 25,000 the next day. That was great, but it really screws up viewing the yearly analytics.
HoR has always been a very “sticky” website, and 5.41 pages per visitor is a pretty good stat I’d say.
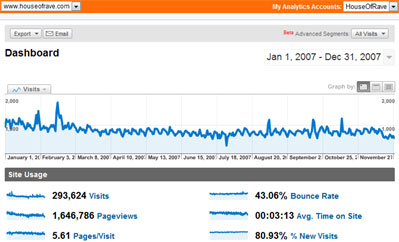
2007:
Some funny activity in the beginning of the year was most likely attributed to this very blog. Whenever I talk about the business in a way that interests people, I can see little spikes in traffic. I don’t particularly care because those visitors from my blog rarely buy anything from HoR…so it doesn’t make me any money. In fact simply talking openly about this business has caused a slew of people to copy. Why on EARTH anyone would want to copy a business model I did back in high school is beyond me… If I could do it over again I would’ve preferably picked a much larger niche.
Judging from this chart, HoR was pretty stagnant or even declining during 2007.
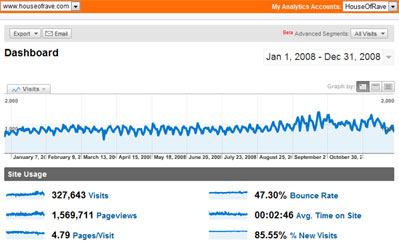
2008:
I ended up doing all sorts of improvements to HoR in 2008 in my own sporadic way. I suppose it helped as traffic went up. Traffic may also have something to do with this blog. Once again, traffic doesn’t necessarily = income. Although I’m sure it doesn’t hurt.
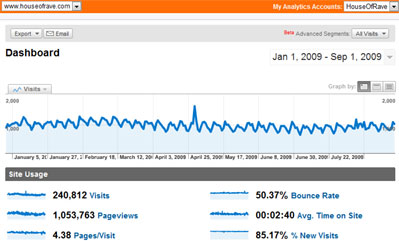
2009 (Up till Sept. 1, 2009):
Here is a snapshot of 2009 thus far. These stats don’t account for 4 busy months of the year, so I’m not sure how trusting I am of them yet. Looking at the stats I notice the Avg. time on site is lower than it was 3 years ago. I suspect 3 years ago people had slower computers and less web savvy. Or maybe the site just sucks and people aren’t staying as long. Who knows.
Site traffic seems to be consistently growing a small bit. Based off my estimates (with information not presented here) it should overall grow to a new high.
From the information presented I need 102,689 more visits this year to equal the traffic of the heavily inflated 2006 sample. Based on the 2008 sample, a yearly avg. for monthly traffic would be 27,303 uniques per month. Multiply that by the extra 4 months in the year and that comes to 109,214 which would put 2009 as the highest traffic year. That 27K average is also probably a low average, since generally the 4th quarter is a higher traffic time for almost every business in the United States.
In addition HoR has an ancillary rave blog that gets 200+ visits per day…those are not included here.
Effects of recession:
I always get asked if this recession has had any effect. Well…yea.
Anytime you get people making less money, lots of money fear etc. etc. people will buy less…especially stuff in the party/retail sector. Also, with lots of big corporations in extreme money-saving mode, most of the really large orders I would get from them have disappeared along with those fat-ass budgets.
This business also sells stuff people don’t really need. We actually have managed to grow believe it or not, but not by the 4X factor we were hoping for late last year. What hurts the most is the indirect effect the recession has taken. HoR sells “hard to find light up stuff“…and “hard to find” roughly equates to “not manufactured that often.” It takes LOTS of money, time and resources to manufacture/store/ship/distribute a single product, and lots of the cool products we once used to carry have gone bye-bye (much to my chagrin). If anything, this has been the single most destructive part of the recession to the business.
Well, recession or not, cheers to a decent 2009! *clink*
